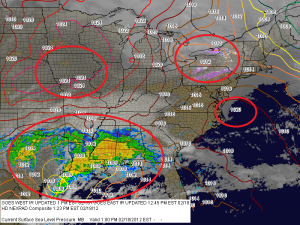
Here is the current surface map. I have highlighted 4 areas to compare to what the GFS model from this morning had shown:

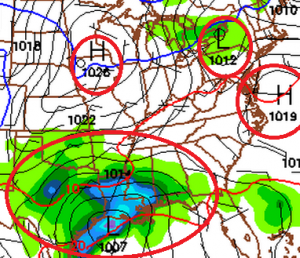
Compare that with the 12z GFS for 18z this afternoon:

As you can see, everything is pretty much going how the GFS said it would. The high pressure over Iowa is basically correct. The high off the Virginia/Carolina coast is correct and the low over western NY is correct.
Most importantly, the low pressure center off the Texas/Louisiana coast is correct and the precipitation extent and intensity is correct. It does have rain further north and west than what is currently falling, so that may be something to watch going forward.
If you would like to follow the progress of the storm, I have created a loop of the surface image that I posted above. It is in experimental mode right now, but should be stable enough to use.
The loop can be found at: https://www.marylandwx.com/f5data/flashsatrad.php
